ClickHouse is a fast, open-source columnar database for real-time analytics. OpenRouter can stream traces directly to your ClickHouse database for high-performance analytics and custom dashboards.

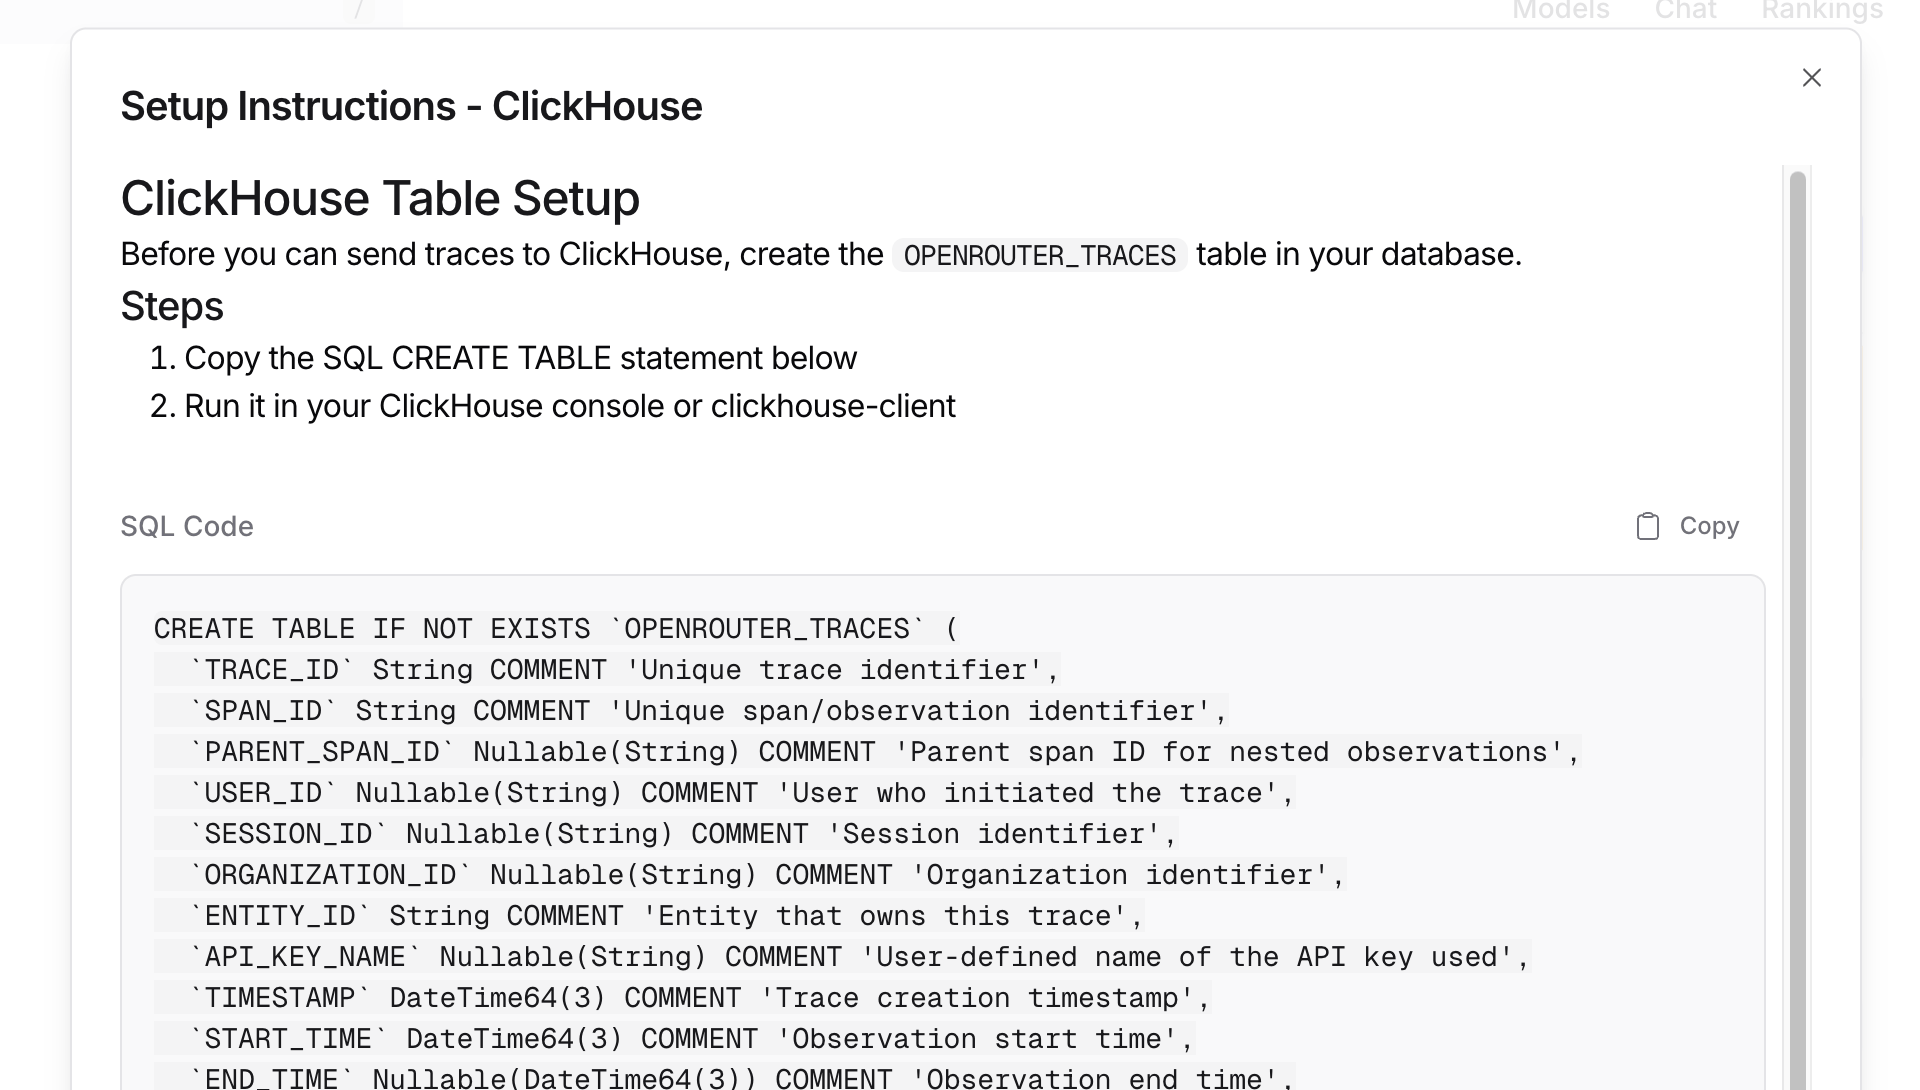
Step 1: Create the traces table

Before connecting OpenRouter, create the OPENROUTER_TRACES table in your ClickHouse database. You can find the exact SQL in the OpenRouter dashboard when configuring the destination:
ClickHouse Setup Instructions

Step 2: Set up permissions

Ensure your ClickHouse user has CREATE TABLE permissions:
GRANT CREATE TABLE ON your_database.* TO your_database_user;

Step 3: Enable Broadcast in OpenRouter

Go to Settings > Observability and toggle Enable Broadcast.
Enable Broadcast

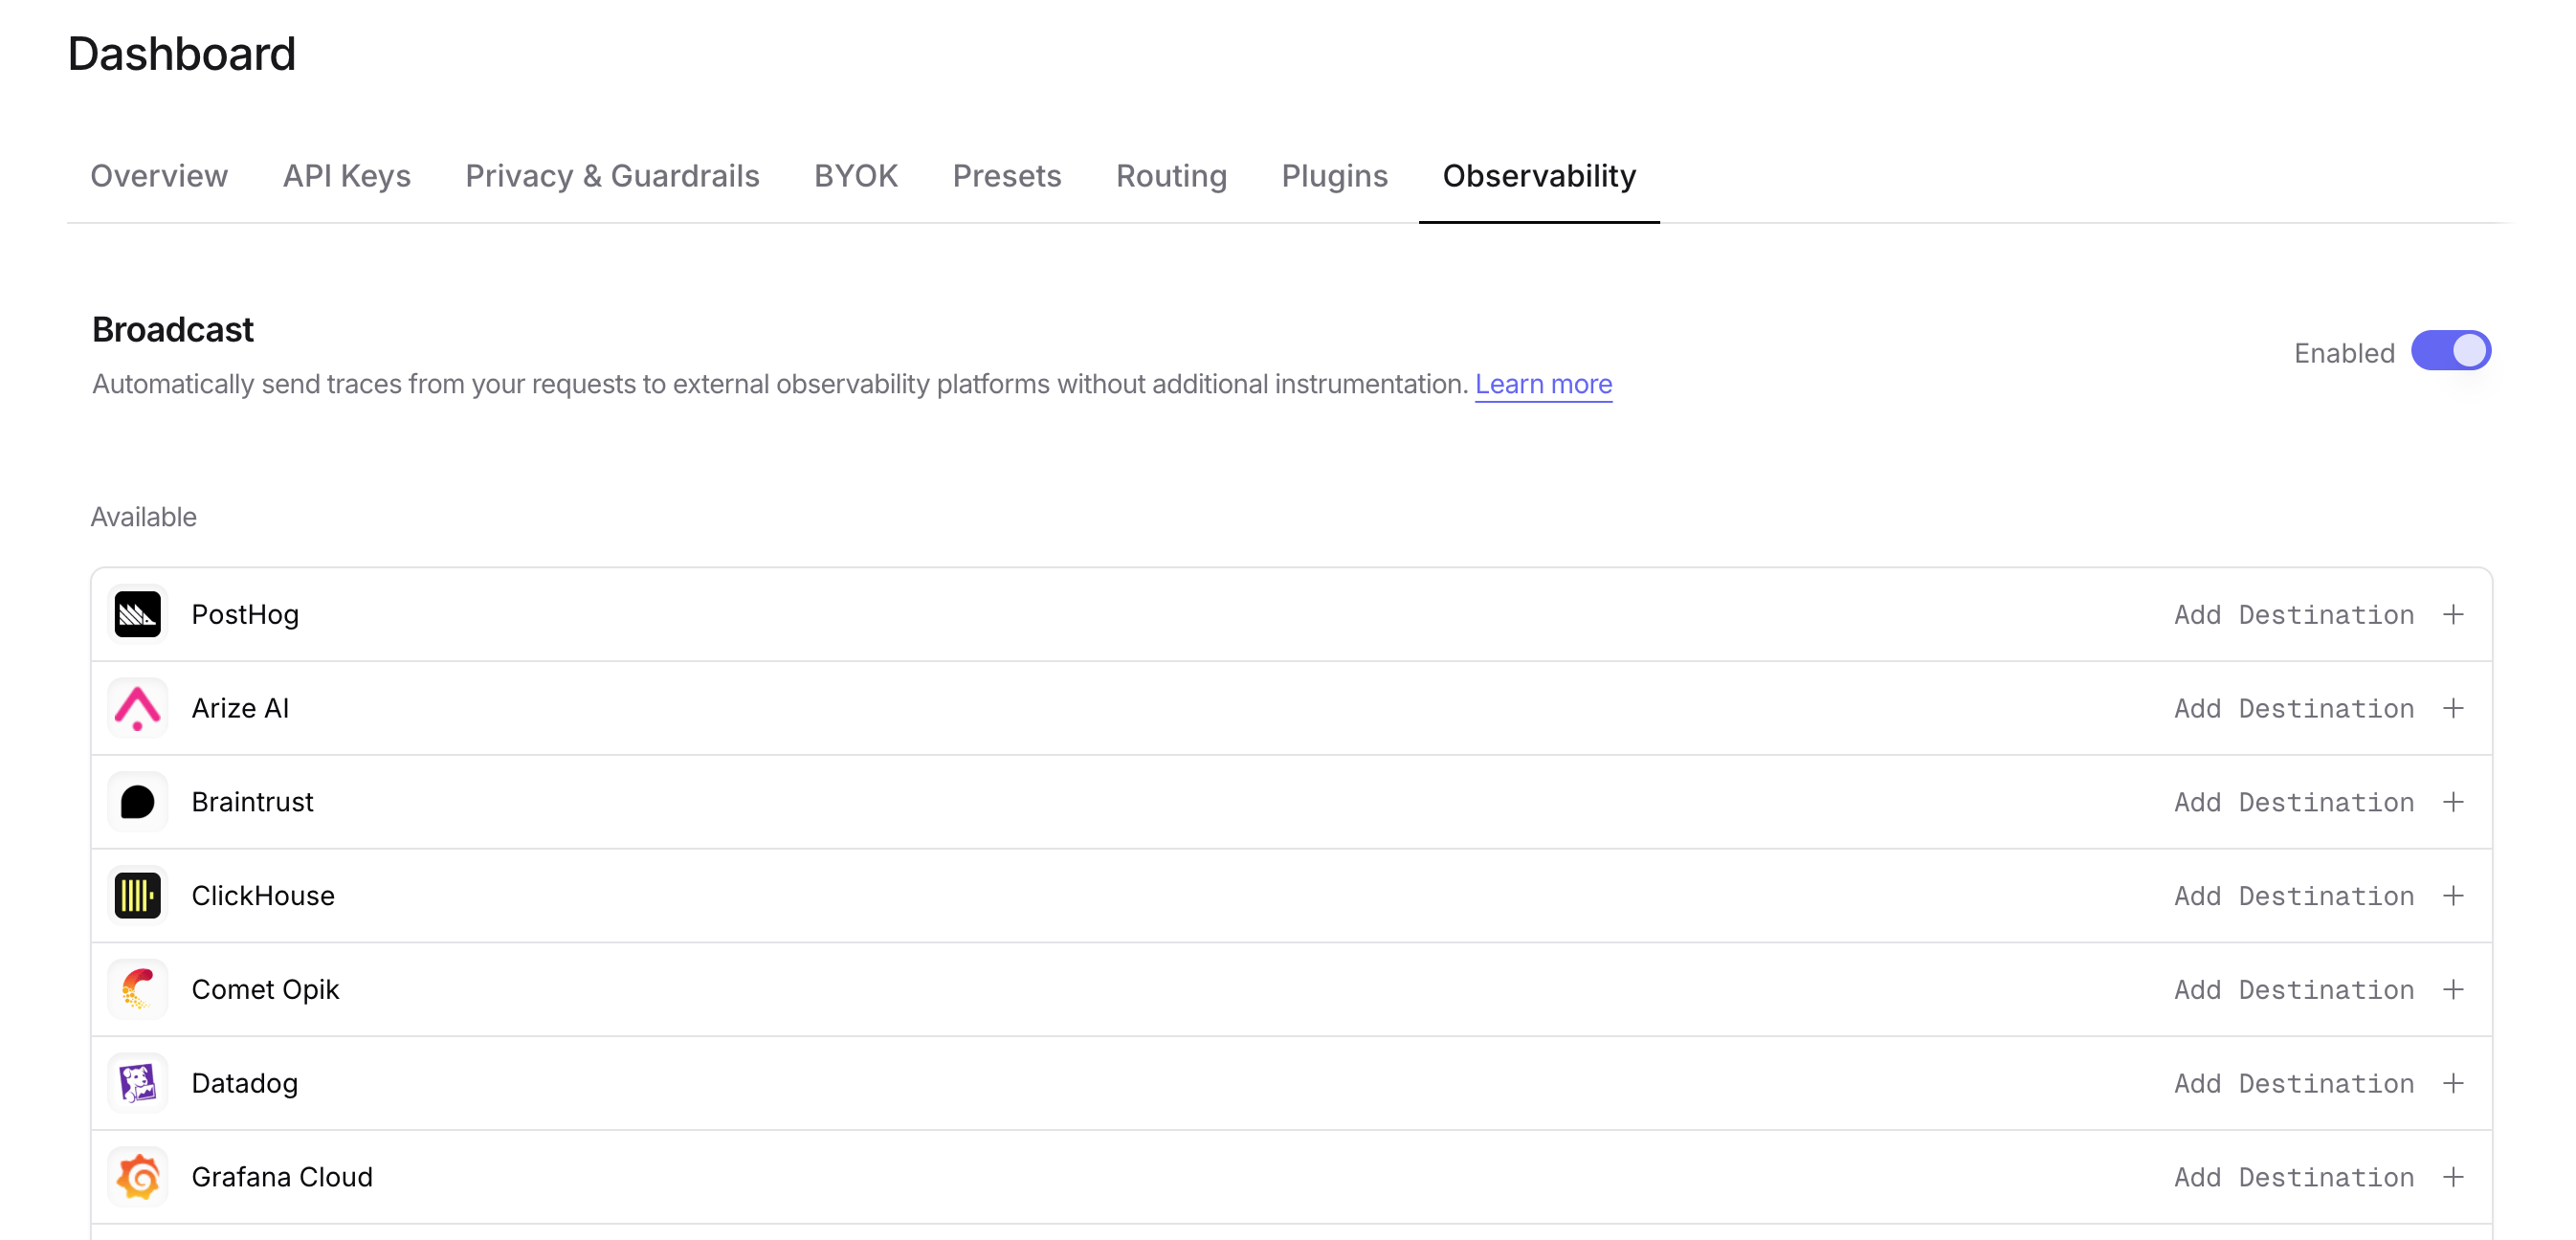
Step 4: Configure ClickHouse

Click the edit icon next to ClickHouse and enter:
ClickHouse Configuration
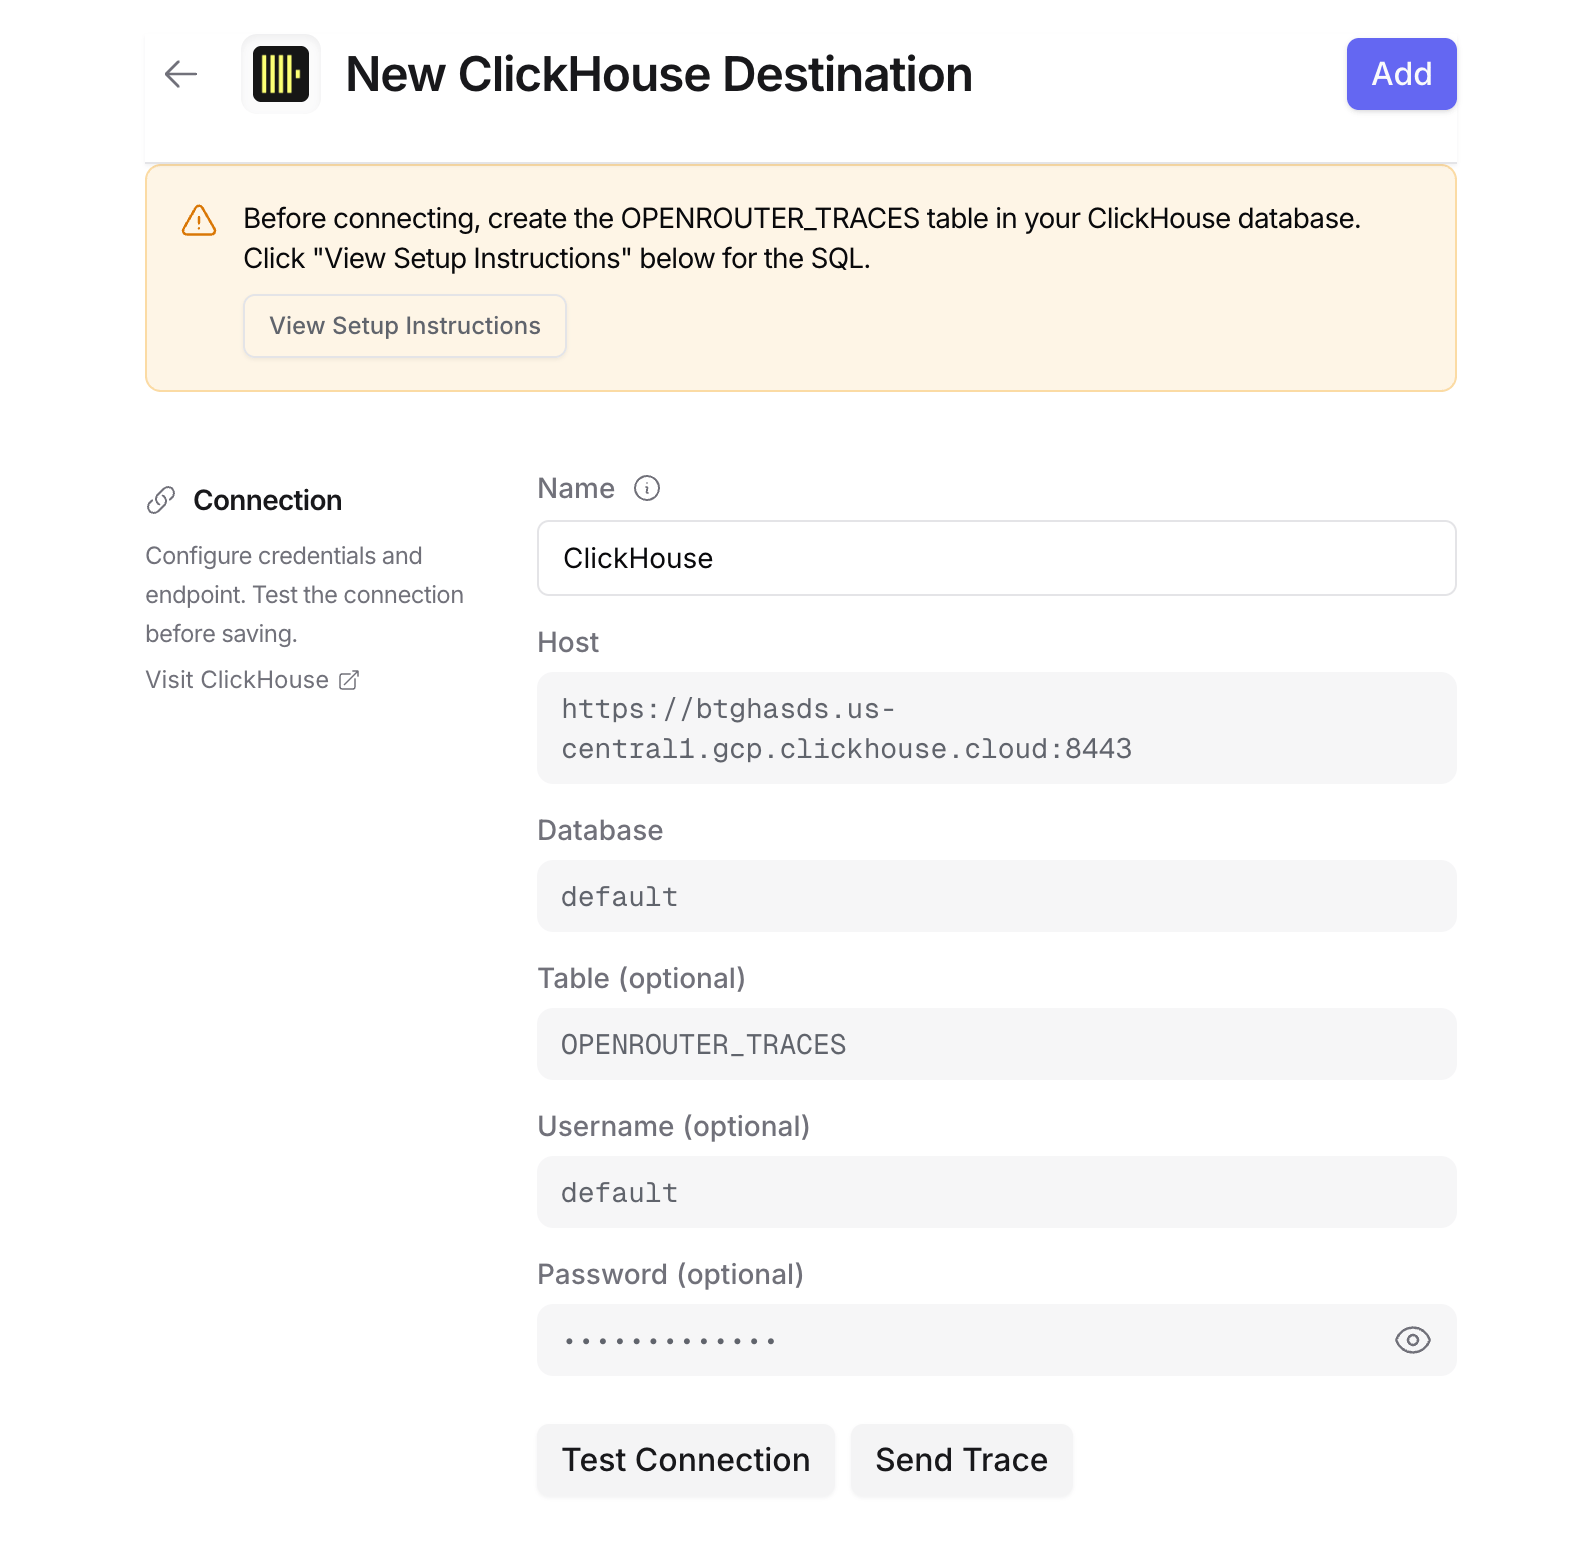
  • Host: Your ClickHouse HTTP endpoint (e.g., https://clickhouse.example.com:8123)
  • Database: Target database name (default: default)
  • Table: Table name (default: OPENROUTER_TRACES)
  • Username: ClickHouse username for authentication (defaults to default)
  • Password: ClickHouse password for authentication
For ClickHouse Cloud, your host URL is typically https://{instance}.{region}.clickhouse.cloud:8443. You can find this in your ClickHouse Cloud console under Connect.

Step 5: Test and save

Click Test Connection to verify the setup. The configuration only saves if the test passes.

Step 6: Send a test trace

Make an API request through OpenRouter and query your ClickHouse table to verify the trace was received.

Example queries

Cost analysis by model

SELECT
  toDate(TIMESTAMP) as day,
  MODEL,
  sum(TOTAL_COST) as total_cost,
  sum(TOTAL_TOKENS) as total_tokens,
  count() as request_count
FROM OPENROUTER_TRACES
WHERE TIMESTAMP >= now() - INTERVAL 30 DAY
  AND STATUS = 'ok'
  AND SPAN_TYPE = 'GENERATION'
GROUP BY day, MODEL
ORDER BY day DESC, total_cost DESC;

User activity analysis

SELECT
  USER_ID,
  uniqExact(TRACE_ID) as trace_count,
  uniqExact(SESSION_ID) as session_count,
  sum(TOTAL_TOKENS) as total_tokens,
  sum(TOTAL_COST) as total_cost,
  avg(DURATION_MS) as avg_duration_ms
FROM OPENROUTER_TRACES
WHERE TIMESTAMP >= now() - INTERVAL 7 DAY
  AND SPAN_TYPE = 'GENERATION'
GROUP BY USER_ID
ORDER BY total_cost DESC;

Error analysis

SELECT
  TRACE_ID,
  TIMESTAMP,
  MODEL,
  LEVEL,
  FINISH_REASON,
  METADATA,
  INPUT,
  OUTPUT
FROM OPENROUTER_TRACES
WHERE STATUS = 'error'
  AND TIMESTAMP >= now() - INTERVAL 1 HOUR
ORDER BY TIMESTAMP DESC;

Provider performance comparison

SELECT
  PROVIDER_NAME,
  MODEL,
  avg(DURATION_MS) as avg_duration_ms,
  quantile(0.5)(DURATION_MS) as p50_duration_ms,
  quantile(0.95)(DURATION_MS) as p95_duration_ms,
  count() as request_count
FROM OPENROUTER_TRACES
WHERE TIMESTAMP >= now() - INTERVAL 7 DAY
  AND STATUS = 'ok'
  AND SPAN_TYPE = 'GENERATION'
GROUP BY PROVIDER_NAME, MODEL
HAVING request_count >= 10
ORDER BY avg_duration_ms;

Usage by API key

SELECT
  API_KEY_NAME,
  uniqExact(TRACE_ID) as trace_count,
  sum(TOTAL_COST) as total_cost,
  sum(PROMPT_TOKENS) as prompt_tokens,
  sum(COMPLETION_TOKENS) as completion_tokens
FROM OPENROUTER_TRACES
WHERE TIMESTAMP >= now() - INTERVAL 30 DAY
  AND SPAN_TYPE = 'GENERATION'
GROUP BY API_KEY_NAME
ORDER BY total_cost DESC;

Accessing JSON columns

ClickHouse stores JSON data as strings. Use JSONExtract functions to query nested fields:
SELECT
  TRACE_ID,
  JSONExtractString(METADATA, 'custom_field') as custom_value,
  JSONExtractString(ATTRIBUTES, 'gen_ai.request.model') as requested_model
FROM OPENROUTER_TRACES
WHERE JSONHas(METADATA, 'custom_field');
To parse input messages:
SELECT
  TRACE_ID,
  JSONExtractString(
    JSONExtractRaw(INPUT, 'messages'),
    1, 'role'
  ) as first_message_role,
  JSONExtractString(
    JSONExtractRaw(INPUT, 'messages'),
    1, 'content'
  ) as first_message_content
FROM OPENROUTER_TRACES
WHERE SPAN_TYPE = 'GENERATION'
LIMIT 10;

Schema design

Typed columns

The schema extracts commonly-queried fields as typed columns for efficient filtering and aggregation:
  • Identifiers: TRACE_ID, USER_ID, SESSION_ID, etc.
  • Timestamps: DateTime64 for time-series analysis with millisecond precision
  • Model Info: For cost and performance analysis
  • Metrics: Tokens and costs for billing

String columns for JSON

Less commonly-accessed and variable-structure data is stored as JSON strings:
  • ATTRIBUTES: Full OTEL attribute set
  • INPUT/OUTPUT: Variable message structures
  • METADATA: User-defined key-values
  • MODEL_PARAMETERS: Model-specific configurations
Use ClickHouse’s JSONExtract* functions to query these fields.

Custom Metadata

Custom metadata from the trace field is stored in the METADATA column as a JSON string. You can query it using ClickHouse’s JSONExtract functions.

Supported Metadata Keys

KeyClickHouse MappingDescription
trace_idTRACE_ID column / METADATA JSONCustom trace identifier for grouping
trace_nameMETADATA JSONCustom name for the trace
span_nameMETADATA JSONName for intermediate spans
generation_nameMETADATA JSONName for the LLM generation

Example

{
  "model": "openai/gpt-4o",
  "messages": [{ "role": "user", "content": "Analyze these metrics..." }],
  "user": "user_12345",
  "session_id": "session_abc",
  "trace": {
    "trace_name": "Metrics Analysis Pipeline",
    "generation_name": "Analyze Trends",
    "team": "data-engineering",
    "pipeline_version": "2.0",
    "data_source": "clickhouse_metrics"
  }
}

Querying Custom Metadata

Use ClickHouse’s JSON functions to query your custom metadata:
SELECT
  TRACE_ID,
  JSONExtractString(METADATA, 'team') as team,
  JSONExtractString(METADATA, 'pipeline_version') as pipeline_version,
  JSONExtractString(METADATA, 'data_source') as data_source,
  TOTAL_COST,
  TOTAL_TOKENS
FROM OPENROUTER_TRACES
WHERE JSONHas(METADATA, 'team')
  AND SPAN_TYPE = 'GENERATION'
ORDER BY TIMESTAMP DESC;

Additional Context

  • The user field maps to the USER_ID typed column
  • The session_id field maps to the SESSION_ID typed column
  • All custom metadata keys from trace are stored in the METADATA JSON string column
  • For high-performance filtering on metadata fields, consider creating materialized columns with ALTER TABLE ... ADD COLUMN

Additional resources

Privacy Mode

When Privacy Mode is enabled for this destination, prompt and completion content is excluded from traces. All other trace data — token usage, costs, timing, model information, and custom metadata — is still sent normally. See Privacy Mode for details.